Using
the Street Tree Inventory
 A street tree inventory defines the current state of the community forest and is used as a benchmark in the master planning process. Once the community forests current state is established with an inventory, the following information can be extracted from it to formulate goals for the master plan. This information includes:
Species distribution - The percentage of each tree species (i.e. how many Sugar Maples, Red Oaks, Honeylocusts, etc.) in relation to all community trees.
Importance to Master Plan
- Species diversity encourages the long term health and sustainability of the community forest and your master plan may state "do not choose trees from any species comprising more than "x"% of the community forest.
- A limit of 5 to 10% of any species is frequently set as a goal and, in this case, there would be a moratorium on planting trees of any species comprising more than 5 to 10% of the street tree population.
- Responsive to threats from invasive pests i.e. we would recommend that species at risk from an aggressive and lethal pest not be planted.
Genus Distribution The percentage of each tree genus (i.e. how many Maples, Oaks, Lindens, etc.) in relation to all community trees.
Importance to Master Plan
- Similar to species diversity, genus diversity encourages the long term health and sustainability of the community forest and your master plan may state do not choose trees from any genus comprising more than x% of the community forest.
- A limit of 10 to 20% of any genus is frequently set as a goal and, in this case, there would be a moratorium on planting trees of any genus comprising more than 10 to 20% of the street tree population.
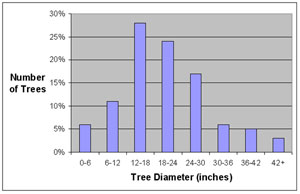
Size class distribution The proportion of trees by size (i.e. their relative age).
Importance to Master Plan
- To optimize the value and benefit of trees, the community forest should have a high percentage of large canopy trees (note: large canopy trees mean large trunk diameters measured by DBH, diameter at breast height). In general, the older and larger the trees, the more benefits provided.
- At the same time, there must be a sufficient number of younger, smaller trees in the street tree population to account for the loss of trees over time and thereby maintain a sustainable community forest.
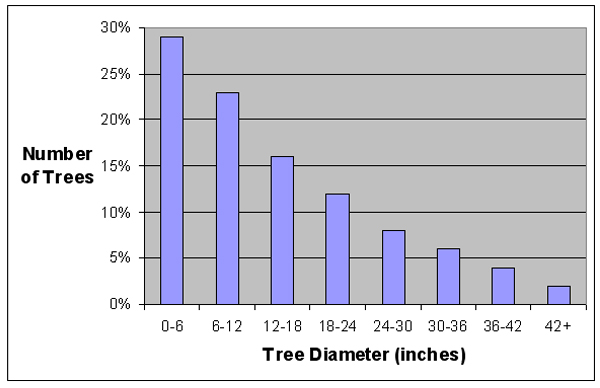
- If you are planting trees regularly, the trend line should be relatively even, tapering off at the larger (older) sizes (see graph below).
Larger image
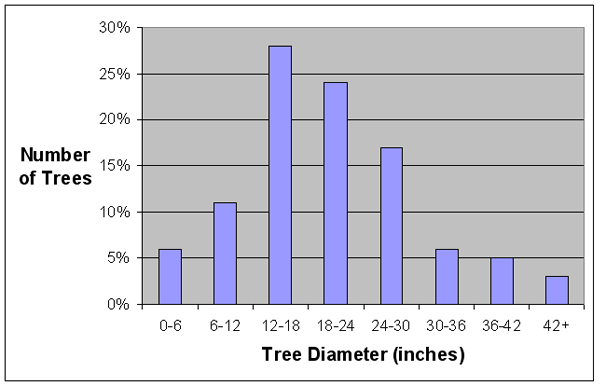
- If your inventory shows few small diameter trees (see graph below), your master plan may state "concentrate on planting new trees until size classes even off".
Larger image
- If your inventory shows few larger diameter trees, you may need to plant more trees that mature at larger sizes and your master plan may state "concentrate on planting trees from larger maturing tree species.
Tree Condition - The percentage of good, fair, poor and dead trees.
Importance to Master Plan
- Once the dead, poor, and fair condition trees are identified, an arborist can assess which trees need to be removed first and provide an estimate of the cost.
- If your inventory shows a high percentage of dead and poor trees, you may have to budget more for removals relative to pruning in the first few years.
- If certain species routinely fall in the poor category, those species should not be planted in the future.
Stocking Level The proportion of existing street trees to the total number of potential street trees (number of trees plus the number of available planting spaces).
Importance to Master Plan
- For a small community, a 75 80% stocking level would be an excellent goal (a 60% stocking level is the national average).
- When planning your annual budget, consider these three factors:
- How many trees must be removed?
- How many trees can you afford to plant? Note: to increase stocking level, the number planted must be greater than the number removed.
- Based on the amount that planting exceeds removal, on an annual basis, how long will it take to reach your stocking level goal?
- Your master plan may state, "increase percent stocking by "x"% in five years." Your communitys budget will determine how much you can increase the number of trees, perhaps by 2 to 10%.
Tree Planting A list of available planting sites.
Importance to Master Plan
- Your community may set priorities for choosing planting sites based on:
- Streets without shade
- Residential areas near commercial or business districts
- People that want a tree. Note: you can send a letter to potential homes with planting sites. State that they have been identified as a planting site and should call if they have questions. After planting, follow-up with property owner by giving the name of tree and care instructions.
- Your master plan may state, "planting sites prioritized by: (1) streets with little shade (2) streets near business districts (3) homes with people that want and will help maintain newly planted trees (4) streets without utility wire conflicts."
The information detailed above can be extracted from the inventory using Excel. In addition, STRATUM (Street Tree Management Tool for Urban forest Managers) can be used to quantify environmental and aesthetic benefits provided by the community forest.
See the links below to find tutorials on using Excel and STRATUM to analyze the data in your inventory.
Back to Conducting a Street Tree Inventory